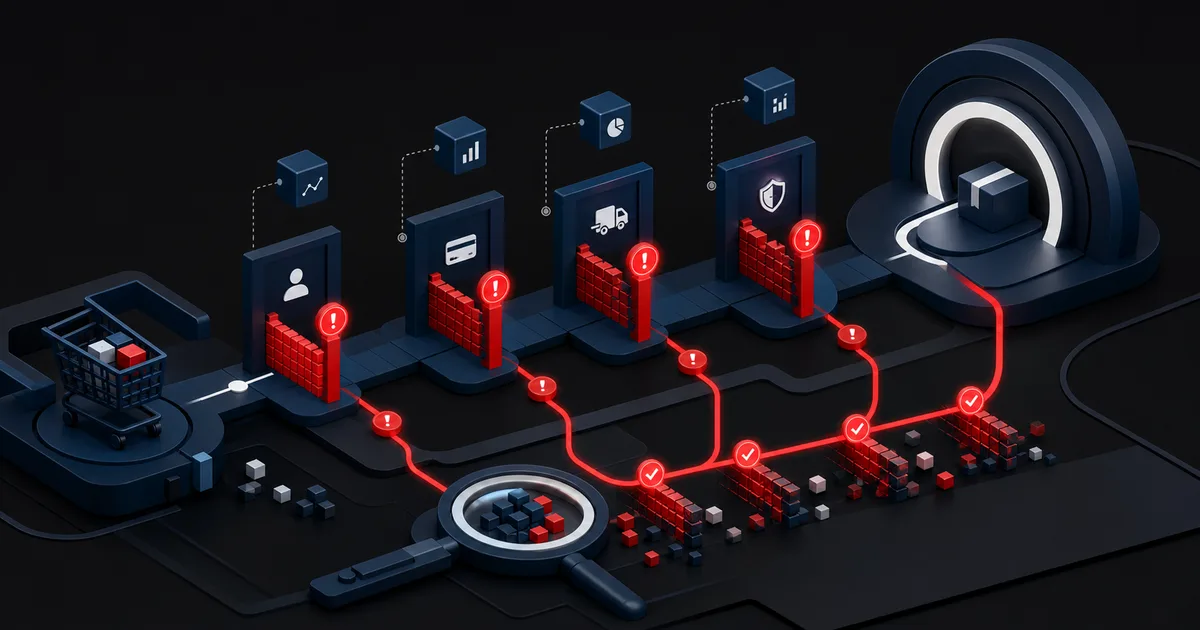
Not everyone who adds a product to the cart and leaves without buying is lost for the same reason. Some visitors are comparing prices, some are saving an item to buy later, and some change their minds the moment they see the shipping cost. Others genuinely want to pay but stop at a form field, a gap in trust, or a technical error. Watching one overall abandonment rate blends those causes together and pushes teams into arbitrary projects to shorten the checkout.
The better approach is to read purchase intent and step-level behavior together, then prove where the friction sits. This guide brings event taxonomy, error logging, user research and operational data into a single diagnostic map. The goal is not to eliminate every abandonment. It is to remove preventable uncertainty, effort and breakage for people who really intend to buy, while keeping mandatory controls such as tax, security and order accuracy intact.
1. Separate cart abandonment, checkout abandonment and payment failure
Cart abandonment happens before the user starts checkout. Checkout abandonment can occur at the address, delivery or payment step. Payment failure is something else again: the attempt is made, but the order never completes because of a bank decline, an authentication step, a network problem or a broken integration. Each one belongs to a different team and calls for a different fix.
A current compilation built on Baymard's 2025 data reports an average cart abandonment rate of 70.22 percent, and the same source notes that a large share of abandonment comes from natural behavior such as browsing or simply not being ready to buy. That external average is neither a target nor a diagnosis for your own store. Your channel mix, devices, products, customer types and measurement definition all move the number.Baymard Institute — Cart Abandonment Rate Statistics (opens in a new tab)
Write down the entry and exit conditions of the funnel. Does it start when a product is added to the cart, or when the cart page is viewed? Is success the order record or the payment authorization? How do you handle the same person switching devices, coming back later, retrying, or losing an item to a stock-out? If the time window and the identity rules are not fixed, weekly rates cannot be compared.
| Situation | Last observed event | Additional evidence needed | First owner |
|---|---|---|---|
| Cart abandonment | Cart viewed, checkout never started | Intent research, cost visibility | Product/UX |
| Checkout abandonment | Exit at the address or delivery step | Field errors, session recordings, user testing | Product/UX |
| Payment failure | Payment attempted, no order | Provider codes, 3DS and network logs | Payments/Platform |
| Operational loss | Order started, no stock or no delivery | Inventory and logistics records | Operations |
2. Build an event taxonomy from step view to error recovery
Measuring page views alone is not enough in a single-page or dynamic checkout. Define business events such as cart_view, checkout_start, contact_complete, address_complete, delivery_selected, payment_attempt, payment_failure and purchase. For every event, the data dictionary should hold the trigger condition, the deduplication key, the required parameters, the personal-data boundary and the owning system. Never send field contents to your analytics platform.
Classify errors with safe codes that are independent of the message the user sees: validation_postcode, inventory_changed, payment_declined, payment_timeout or provider_unavailable. Separate events let you tell that someone saw an error, corrected it and moved on. Rather than exposing the provider code to the shopper, use an internal taxonomy that support and payments teams can map back.
Client events, server-side orders and provider records have to reconcile. The purchase event must not fire again when the page is refreshed. The finance or order system is the source of truth, and behavioral analytics is the diagnostic layer.
- Every checkout step has a defined start event and success event.
- Error codes are safe and independent of user-facing text.
- Deduplication, back-navigation and retry rules are written down.
- Personal and payment data never reach analytics parameters.
- Analytics, order and payment provider totals are reconciled.
- Segments exist for device, channel, new versus returning customer and payment method.
3. Split friction into cost, effort, uncertainty, trust and breakage layers
Cost friction is shipping, tax, a service fee or a currency difference showing up too late. Effort friction is unnecessary fields, a forced account, re-entering data and the wrong keyboard. Uncertainty is not understanding the delivery date, the return policy, stock or the final total. Trust friction is a merchant and a payment flow that do not look credible. Breakage is an error, a timeout, a lost session or a payment provider outage.
One change can make another layer worse. A single page cuts clicks but can raise cognitive load. Trust badges easily create clutter, while clear merchant details, a plain return policy and a consistent payment interface are worth more. Guest checkout lowers effort, but order tracking still has to be offered openly.
For every hypothesis, look for behavioral data, technical evidence and qualitative observation. If one field shows a high error rate, session recordings or usability testing can show why. If errors rise on one payment method, you need the provider log. A user interview can explain surprise at the total, and a heatmap on its own will never tell you about purchase intent.
| Layer | Signal | Validation | Possible intervention |
|---|---|---|---|
| Cost | Exit once the total becomes visible | Research and price distribution | Show cost earlier and plainly |
| Effort | Field errors and long completion times | Form analytics and task testing | Remove needless fields, allow autofill |
| Uncertainty | Back-navigation at the delivery step | Support questions and interviews | Explain dates, stock and conditions |
| Trust | A pause right before payment | User testing | Clarify merchant and policy information |
| Breakage | Attempt made, no order | Server and provider logs | Fix the root cause, offer a safe retry |
4. Fix input purpose, error recovery and accessibility before shortening the form
Field count is not the only measure of quality. Ask only for what the order, the delivery, a regulation or fraud control genuinely requires, and document internally why each field exists. Labels should be visible and persistent, help text should sit close to its context, and required fields should be obvious. An error message has to say what is wrong and how to fix it, and nobody should lose what they typed after a failed submission.
The W3C explanation of Identify Input Purpose in WCAG 2.2 asks that the purpose of common user-related fields be defined programmatically. HTML autocomplete values can express the more specific purpose of fields such as name, email, phone and address. That helps supporting browsers fill in the right data automatically, and it lets some assistive technologies present the field differently.W3C WAI — Understanding SC 1.3.5 Identify Input Purpose (opens in a new tab)
Test keyboard order, focus visibility, screen reader names, the error summary, zoom and the mobile keyboard type. Do not block pasting into card number or one-time code fields without a reason. If you offer address autocomplete, keep a manual entry path. Accessibility is not only a compliance task: it delivers less re-entry and more reliable error recovery.
- Why each field is needed for the order is documented.
- Visible labels, correct input types and autocomplete values are in place.
- Error messages are tied to the field, clear and actionable.
- Entered data is safely preserved when a submission fails.
- Keyboard, screen reader, zoom and mobile input have been tested.
- A manual entry path sits alongside automatic address lookup.
5. Hypothetical scenario: diagnosing the loss at the mobile delivery step
This scenario is hypothetical. It is not real customer data and not a promise of conversion. In one store, mobile checkout starts strongly, but the move from the delivery step to the payment step is weak. The team's first instinct is to design a single-page checkout. Event data shows that postal code validation errors cluster around certain addresses, and support tickets show that users do not see the delivery fee until this step.
The inputs are step transitions, field error codes, the delivery cost distribution, device data, payment attempts and five task tests. In testing, automatic address lookup fails to find some newer neighborhoods, the manual entry link is not visible, and the fee is added only after the address is confirmed. Users stop because they cannot enter the right address and because the total is unexpected, not because the form is long.
The decision is not to flip the architecture to a single page straight away. Instead the team makes the manual address path visible, adds a fallback for the validation service, shows an estimated delivery fee in the cart and rewrites the error message. Changes ship in stages. Success is measured through delivery error-recovery rate, progression to the payment step, order accuracy, support volume and overall performance together.
6. Move from diagnosis to experiments and lasting operations
Fix measurement errors and critical technical breakage first, because running an A/B test on a broken payment flow is weak both ethically and analytically. Then write the hypothesis in one sentence: a change that reduces a specific friction for a specific user segment will improve a specific step behavior without damaging protective metrics such as order accuracy or fraud. Packing many changes into one experiment obscures the cause.
Order conversion can be the primary metric, but payment success rate, average order value, returns, fraud, support load, page performance and accessibility are the guardrails. Plan sample size and duration before the test, and do not read percentages on their own at low volume. An average that merges different payment methods and devices can hide a serious failure inside one segment.
A workable sequence is funnel and reconciliation in week one, error taxonomy in week two, critical fixes in week three, and controlled experiments in week four. Weekly operations review provider errors and support themes. Every release needs a synthetic purchase test and a rollback procedure.
- Measurement and order reconciliation were verified before the experiment.
- The hypothesis names one friction, one segment and the expected behavior.
- Safety and operational guardrails were chosen alongside the primary metric.
- Results are reviewed by device, channel and payment method.
- Synthetic tests and alerts run for the critical flow.
- Payment provider outage and rollback procedures have been rehearsed.
7. Limits and failure modes: not every abandonment is preventable
Comparing options, researching gifts, waiting for budget or using the cart as a bookmarking tool are all natural abandonment behaviors. Pressuring people with fake scarcity, pre-selected add-ons or fees that are hard to find may move a short-term metric while damaging trust, return rates and legal exposure. The goal is not to manipulate intent but to make an informed decision easier.
Common failures include treating an industry average as a target, mistaking the thank-you page for a single source of truth, confusing bank declines with UX abandonment, lumping all mobile users together, removing security as if it were needless friction, and answering every problem by deleting a field. Fraud and strong customer authentication rules vary by market, so payments and legal specialists belong in the decision.
Cookie rejection, ad blockers, device switching and the limits of identity resolution can all leave the behavioral funnel incomplete. Triangulate analytics numbers with order, finance, provider and qualitative research. Even a better rate is not a good result if order accuracy, support load and returns deteriorate. Checkout is not page design. It is the business system where product, price, logistics, payment and trust meet.
Conclusion
Do not manage checkout abandonment with a single percentage. Define the type of abandonment, reconcile your event and error taxonomy with real order data, split friction into layers, and change only the root causes you have proven, in a controlled way.
Frequently Asked Questions
Sources
- Baymard Institute — Cart Abandonment Rate Statistics (opens in a new tab)
Cart abandonment rate compilation, natural abandonment behavior and 2025 research into reasons
- W3C WAI — Understanding SC 1.3.5 Identify Input Purpose (opens in a new tab)
The programmatic purpose of form fields and the benefits of using autocomplete
Reduce checkout loss with friction evidence, not assumptions
Let us bring funnel events, form errors, payment records and user tasks together, and build your prioritized checkout improvement plan.
Start my checkout friction analysis